It is only fitting that the twilight days of the Biden admin would exhibit more of the same fakeness that defined not only all of the past four years, but certainly the fakeness of that Kamala Harris presidential campaign which had a billion dollars a month ago and ended up in failure, broke and in debt. We are talking, of course, about the relentless debt-funded spree that somehow became synonymous with economic success in the US.
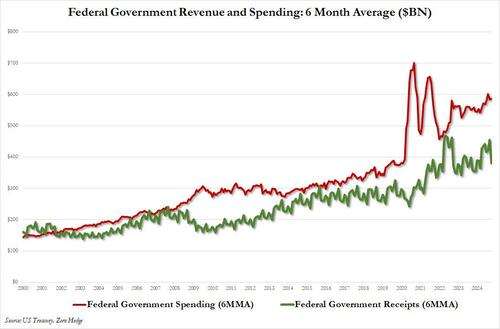
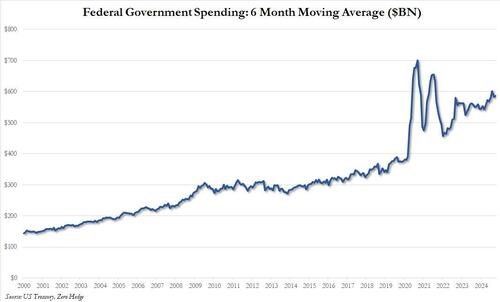
According to the latest Treasury data released today, in October – the first month of fiscal 2025 – the US spent a massive $584.2 billion, a 24.3% increase from the prior year, and a record government outlay for the month of October. On a trailing 6 month moving average basis, to smooth out outliers months, the spending hit $586 billion, effectively at an all time high with just the record spending spree during covid pushing government spending higher.
Key drivers of the deficit widening included outlays in the Departments of Health and Human Services and of Defense, up 12% and 13% respectively, adjusted for calendar differences. Health spending alone jumped by $62 billion compared with the same month last year.
At the same time, the US government collected just $326.8 billion in taxes, down a massive 19% from the $403.434 billion last October, and down even more from the $527 billion in tax receipts in September ’24. As shown in the next chart, while spending continued to grow exponentially, tax receipts have flatlined, and the 6 month average in October was just $380 billion, the same as three years ago!
It’s actually worse than it looks: according to the Treausry, last year’s October tax receipts were unusually higher due to deferred tax receipts that were received that month from companies and individuals affected by disasters including wildfires in California. Taking that into account, the budget deficit this October would have been 22% higher, a Treasury official said.
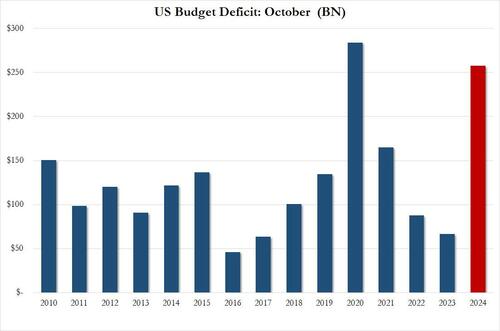
In any case, netting the two means that the US deficit exploded in October to a staggering $257.5 billion, and even though this included several calendar adjustments – which explains the freak September surplus which as we said was due to calendar effects – the number was not only $25 billion more than consensus estimates of a $232.5 billion deficit, it was a staggering 4x bigger than the $66.6 billion deficit in October of 2023. Worse, it was the second highest October deficit on record, and only the budget busting October when the US was spending to prevent an all-out economic implosion, was bigger.
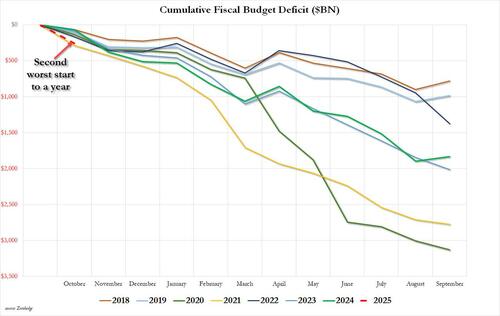
And putting the deficit in context, October – the first month of the fiscal year – was just shy of the biggest deficit start to a year for the US Treasury on record, with just fiscal 2021 (i.e. October 2020) bigger.
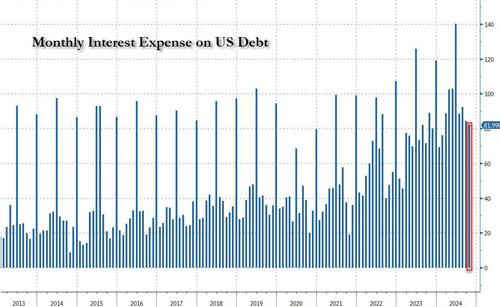
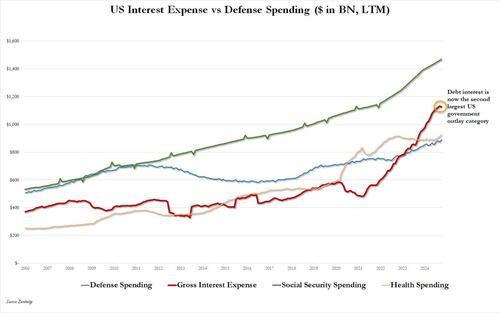
In contrast with what has been a terrifying trend for some time now, the Treasury’s debt-servicing costs only rose slightly in October. Gross interest costs totaled $82 billion in October, unexpectedly down $7 billion from $89 billion in the same month a year before.
The drop meant that LTM interest spending posted the first (very modest) sequential drop – from $1.133 trillion to $1.126 trillion – since August 2023.
That’s because the weighted average interest rate for total outstanding debt by the end of September was 3.30%, at roughly 15-year highs, but down slightly from the month before, the second monthly decline.
However, don’t expect this decline in interest spending to persist because even though the Fed has cut rates twice since September, this has been more than offset by the surge in debt which at last check was just shy of $36 trillion, and unless Elon’s Department for Government Efficiency (DOGE) manages to somehow slash trillions in both spending, this is what US debt will look like for the next few years, guaranteeing that interest on said debt will very soon become the single largest spending category for the US government.
It’s either going to work or it’s not. Here is the alternative https://t.co/cHZA2wHnPB pic.twitter.com/LMEI4tISZL
— zerohedge (@zerohedge) November 13, 2024
The mindblowing figures illustrate the monumental challenge for Trump and all those promising to rein in US debt, which has exploded to 120% of GDP after four years of Biden’s “drunken-sailor” spending ways. Last night Trump tapped Elon Musk and Vivek Ramaswamy to look at ways to cut spending. Thursday’s figures showed the bulk of the outlays are in areas that are bound to be politically challenging to address, in other words, any cuts even remotely close to the $2 trillion suggested by Vivek would lead to a revolt.
Loading…
Originally Posted at; https://www.zerohedge.com//

