Americans Spend Big On Christmas Cheer… And Mums

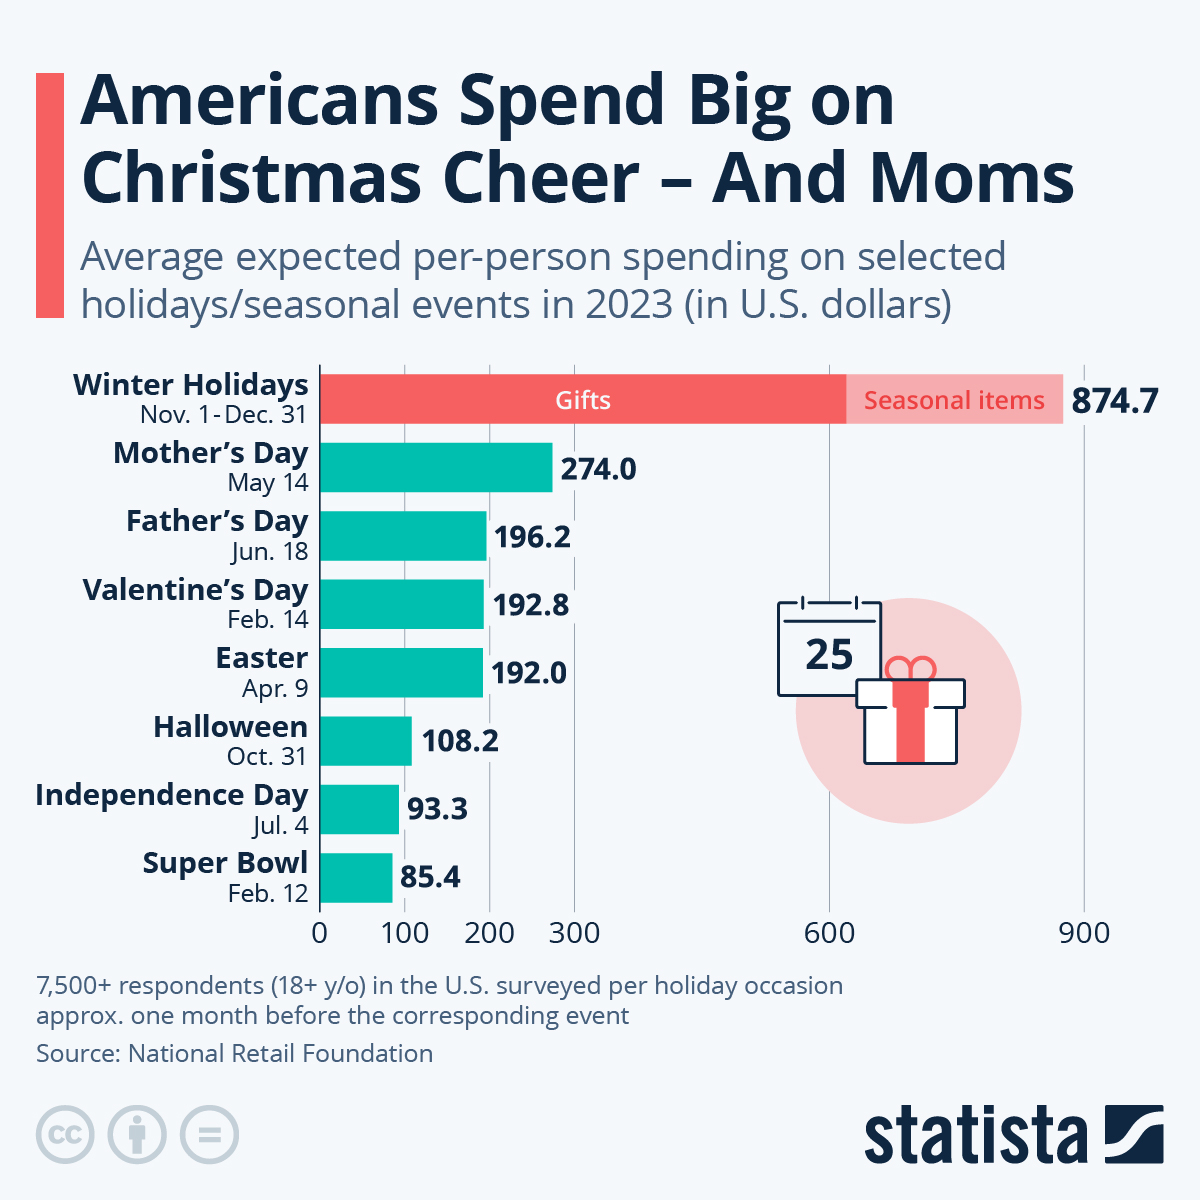
With an expected per-person spending of $875, no other holiday rooted in long-standing tradition comes close to the winter holiday season, which starts on November 1 and ends on December 31. 

You will find more infographics at Statista

As Statista’s Florian Zandt reports, data from the National Retail Federation (NRF) shows that spending for the runner-up, Mother’s Day, only amounts to one third of Thanksgiving and Christmas consumer spending, with no other seasonal event coming close.

While Mother’s Day spending stood at $274 per person in 2023, Father’s Day, Valentine’s Day and Easter ranged between $192 and $196 in the past year. 

Halloween, where money is mostly spent on costumes and decorations according to additional data from the NRF, comes in sixth with an expected per-person spend of $108. While most of the holidays featured on the list have roots in history reaching back hundreds to thousands of years, the Super Bowl is a relatively new phenomenon. This fact notwithstanding, U.S. Americans on average still spend $85 per person on arguably the most important U.S. sports event of the year.

When taking into account not just festivities connected to specific celebrations, two other occasions take the first and second spots in the ranking: Back-to-college and back-to-school. However, these two events are not comparable to the rest of the list, since the average expected spending of $1,367 and $890, respectively, is calculated by household and not per person. Having more than one individual per household in need of school supplies, clothing or electronics for the new school year can skew the results. Therefore, it’s likely that even while the per-household figures for back-to-college and back-to-school are higher, the winter holiday season still ranks first in individual spending.

Loading…


Originally Posted at; https://www.zerohedge.com//


Related Posts

Visualizing 80 Years Of The Gold-to-Oil Ratio

Visualizing 80 Years Of The Gold-to-Oil Ratio

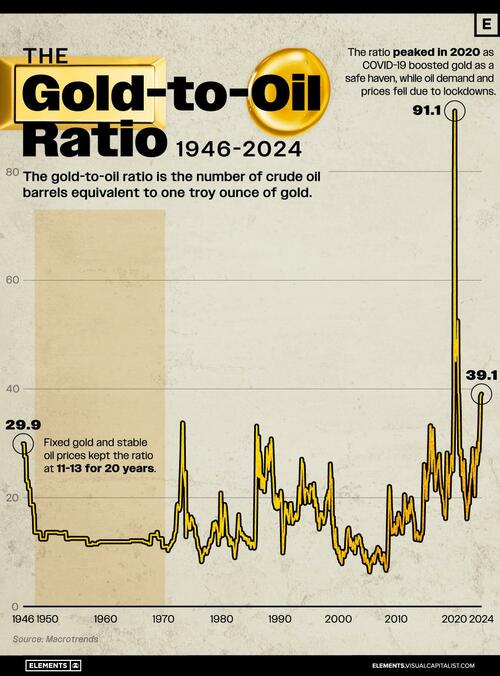
Gold and oil – two of the most influential commodities on the planet – have a fascinating relationship that has evolved over decades, captured in the gold-to-oil ratio.

The gold-to-oil ratio represents the number of barrels of crude oil equivalent in price to one troy ounce of gold.

It is viewed as an indicator of the health of the global economy, indicating when gold or oil prices are significantly out of balance with each other.

This graphic, via Visual Capitalist’s Niccolo Conte, shows the gold-to-oil ratio since 1946, using data compiled by Macrotrends.

What is the Gold-to-Oil Ratio?

The gold-to-oil ratio expresses the price relationship between gold and West Texas Intermediate (WTI) crude oil. WTI is a grade of crude oil and one of the three primary benchmarks for oil pricing, along with Brent and Dubai Crude.

A high ratio indicates that gold is relatively expensive compared to WTI crude oil, and vice versa. This can indicate periods of outsized demand for energy in the form of crude oil, or periods of monetary uncertainty when there is higher demand for gold.

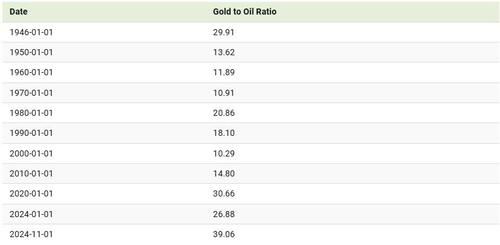
Below is the gold-to-oil ratio every decade between 1946 and 2024.

During the 1950s and 1960s, fixed gold prices and stable oil prices kept the ratio between 11 and 13 for 20 years.

Since the 1980s, the ratio has typically traded within the range of 6 to 40 with a notable exception: in 2020 when the ratio reached a high of 91.1. The peak in 2020 was driven by COVID-19, which boosted gold prices as a safe haven while oil demand and prices plummeted due to global lockdowns.

In contrast, between 2000 and 2008, oil prices were relatively high compared to gold. During this period, the ratio dropped to nearly 6 but never rose above 16.

When comparing the two commodities, it’s worth remembering that the crude oil market is around 10 times larger than that of gold, making it the largest commodity market in the world.

If you enjoyed this graphic, make sure to check out this graphic that shows the top countries by natural resource value.

Tyler Durden
Thu, 11/21/2024 – 18:00

Chris Hedges: Organized Oblivion

from MintPress News: Washington DC — (Scheerpost) — I am in the The Krikor and Clara Zohrab Information Center next to the St. Vartan Armenian Cathedral in Manhattan. I am holding a bound, hand-written memoir, which includes poetry, drawings, and scrapbooked images, by Zaven Seraidarian, a survivor of the Armenian genocide. The front cover of the […]

You Missed

Visualizing 80 Years Of The Gold-to-Oil Ratio

Visualizing 80 Years Of The Gold-to-Oil Ratio

Chris Hedges: Organized Oblivion

Chris Hedges: Organized Oblivion
Russia says US is actively trying to prolong war in Ukraine

False Alarm: Ambulances at Mar-a-Lago Part of JD Vance Motorcade

False Alarm: Ambulances at Mar-a-Lago Part of JD Vance Motorcade

Don’t Ruin Idaho: 42% Say the State Is on the Wrong Track

Don’t Ruin Idaho: 42% Say the State Is on the Wrong Track

The Real Reason Why Men Don’t Approach Beautiful Women

The Real Reason Why Men Don’t Approach Beautiful Women