Virginia Family’s EZ-Pass Charged $576 After Driving RV Just 45 Miles On State Toll Road

It’s easy to laugh off people who constantly complain that the government is watching their every move and has hands in their wallets. Then, you stumble upon a story like Jeff Landry’s. 

When Landry set off for a camping trip with his family near Virginia’s Luray Caverns in early October, he expected to pay some tolls – especially because he had his RV.

Traveling from Falls Church with his wife and youngest child following in a minivan, they took I-66’s express lanes during peak hours, expecting to pay $30 or so each way in tolls. But to his surprise, when the EZ-Pass charges appeared days later, the bill totaled an eye-popping $569.50 for the roundtrip, according to MSN/MotorBiscuit.

At first, Jeff thought the bill was a mistake, but after checking the toll website, he realized it was accurate.

The MSN/MotorBiscuit writeup says that his three-axle RV was charged a premium due to its size, but $569.50 for a 22-mile round trip felt excessive to him. He hadn’t anticipated how much dynamic pricing could drive up tolls for larger vehicles during peak hours.

It turns out…the I-66 express lanes, managed by I-66 Express Mobility Partners, adjust toll rates based on traffic demand, charging drivers more to bypass congestion.

Larger vehicles, like Jeff’s 1997 Holiday Rambler RV, incur even higher tolls due to their size and road impact. According to a toll operator’s spokesperson, Jeff’s RV wouldn’t even qualify to use certain other toll lanes in Virginia, so the high charges are firm.

The writeup notes that drivers unfamiliar with toll pricing can easily misjudge costs, as Jeff did.

It says to avoid similar surprises, plan your trip to avoid peak hours, when toll rates are highest; traveling during off-peak times can significantly reduce toll charges. Additionally, check your vehicle’s toll classification, especially if you’re driving a larger, multi-axle vehicle, which typically incurs higher tolls. Lastly, explore alternative routes.

While non-express lanes may add some travel time, they can save large vehicle drivers hundreds of dollars. For Jeff, the express lane shaved only 20 minutes off his trip—an advantage that, in retrospect, didn’t justify the steep toll.

Or, maybe just stay home next time…

Loading…


Originally Posted at; https://www.zerohedge.com//


Related Posts

Visualizing 80 Years Of The Gold-to-Oil Ratio

Visualizing 80 Years Of The Gold-to-Oil Ratio

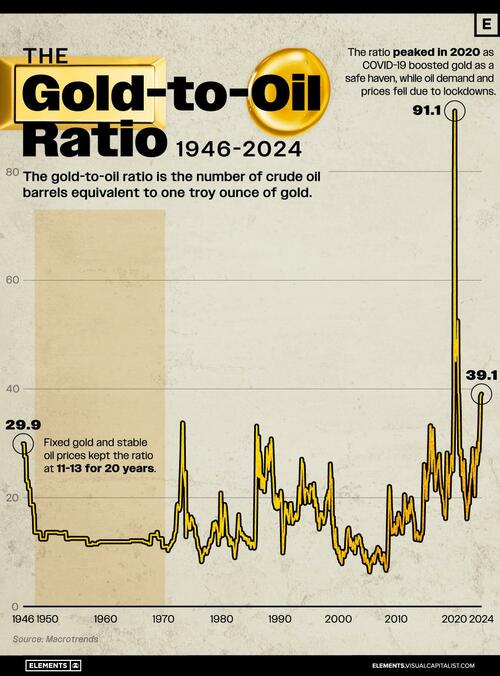
Gold and oil – two of the most influential commodities on the planet – have a fascinating relationship that has evolved over decades, captured in the gold-to-oil ratio.

The gold-to-oil ratio represents the number of barrels of crude oil equivalent in price to one troy ounce of gold.

It is viewed as an indicator of the health of the global economy, indicating when gold or oil prices are significantly out of balance with each other.

This graphic, via Visual Capitalist’s Niccolo Conte, shows the gold-to-oil ratio since 1946, using data compiled by Macrotrends.

What is the Gold-to-Oil Ratio?

The gold-to-oil ratio expresses the price relationship between gold and West Texas Intermediate (WTI) crude oil. WTI is a grade of crude oil and one of the three primary benchmarks for oil pricing, along with Brent and Dubai Crude.

A high ratio indicates that gold is relatively expensive compared to WTI crude oil, and vice versa. This can indicate periods of outsized demand for energy in the form of crude oil, or periods of monetary uncertainty when there is higher demand for gold.

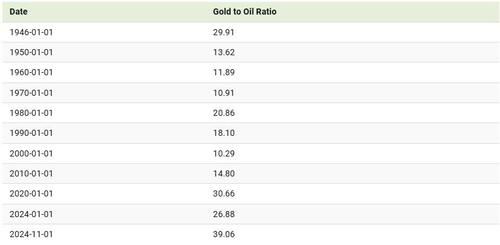
Below is the gold-to-oil ratio every decade between 1946 and 2024.

During the 1950s and 1960s, fixed gold prices and stable oil prices kept the ratio between 11 and 13 for 20 years.

Since the 1980s, the ratio has typically traded within the range of 6 to 40 with a notable exception: in 2020 when the ratio reached a high of 91.1. The peak in 2020 was driven by COVID-19, which boosted gold prices as a safe haven while oil demand and prices plummeted due to global lockdowns.

In contrast, between 2000 and 2008, oil prices were relatively high compared to gold. During this period, the ratio dropped to nearly 6 but never rose above 16.

When comparing the two commodities, it’s worth remembering that the crude oil market is around 10 times larger than that of gold, making it the largest commodity market in the world.

If you enjoyed this graphic, make sure to check out this graphic that shows the top countries by natural resource value.

Tyler Durden
Thu, 11/21/2024 – 18:00

Chris Hedges: Organized Oblivion

from MintPress News: Washington DC — (Scheerpost) — I am in the The Krikor and Clara Zohrab Information Center next to the St. Vartan Armenian Cathedral in Manhattan. I am holding a bound, hand-written memoir, which includes poetry, drawings, and scrapbooked images, by Zaven Seraidarian, a survivor of the Armenian genocide. The front cover of the […]

You Missed

Visualizing 80 Years Of The Gold-to-Oil Ratio

Visualizing 80 Years Of The Gold-to-Oil Ratio

Chris Hedges: Organized Oblivion

Chris Hedges: Organized Oblivion
Russia says US is actively trying to prolong war in Ukraine

False Alarm: Ambulances at Mar-a-Lago Part of JD Vance Motorcade

False Alarm: Ambulances at Mar-a-Lago Part of JD Vance Motorcade

Don’t Ruin Idaho: 42% Say the State Is on the Wrong Track

Don’t Ruin Idaho: 42% Say the State Is on the Wrong Track

The Real Reason Why Men Don’t Approach Beautiful Women

The Real Reason Why Men Don’t Approach Beautiful Women